HyperTuned
System performance and kernel profiler for macOS. Watch CPU and unified-memory telemetry, see live kernel limits, and evaluate tuning recommendations in one native dashboard.
What it does
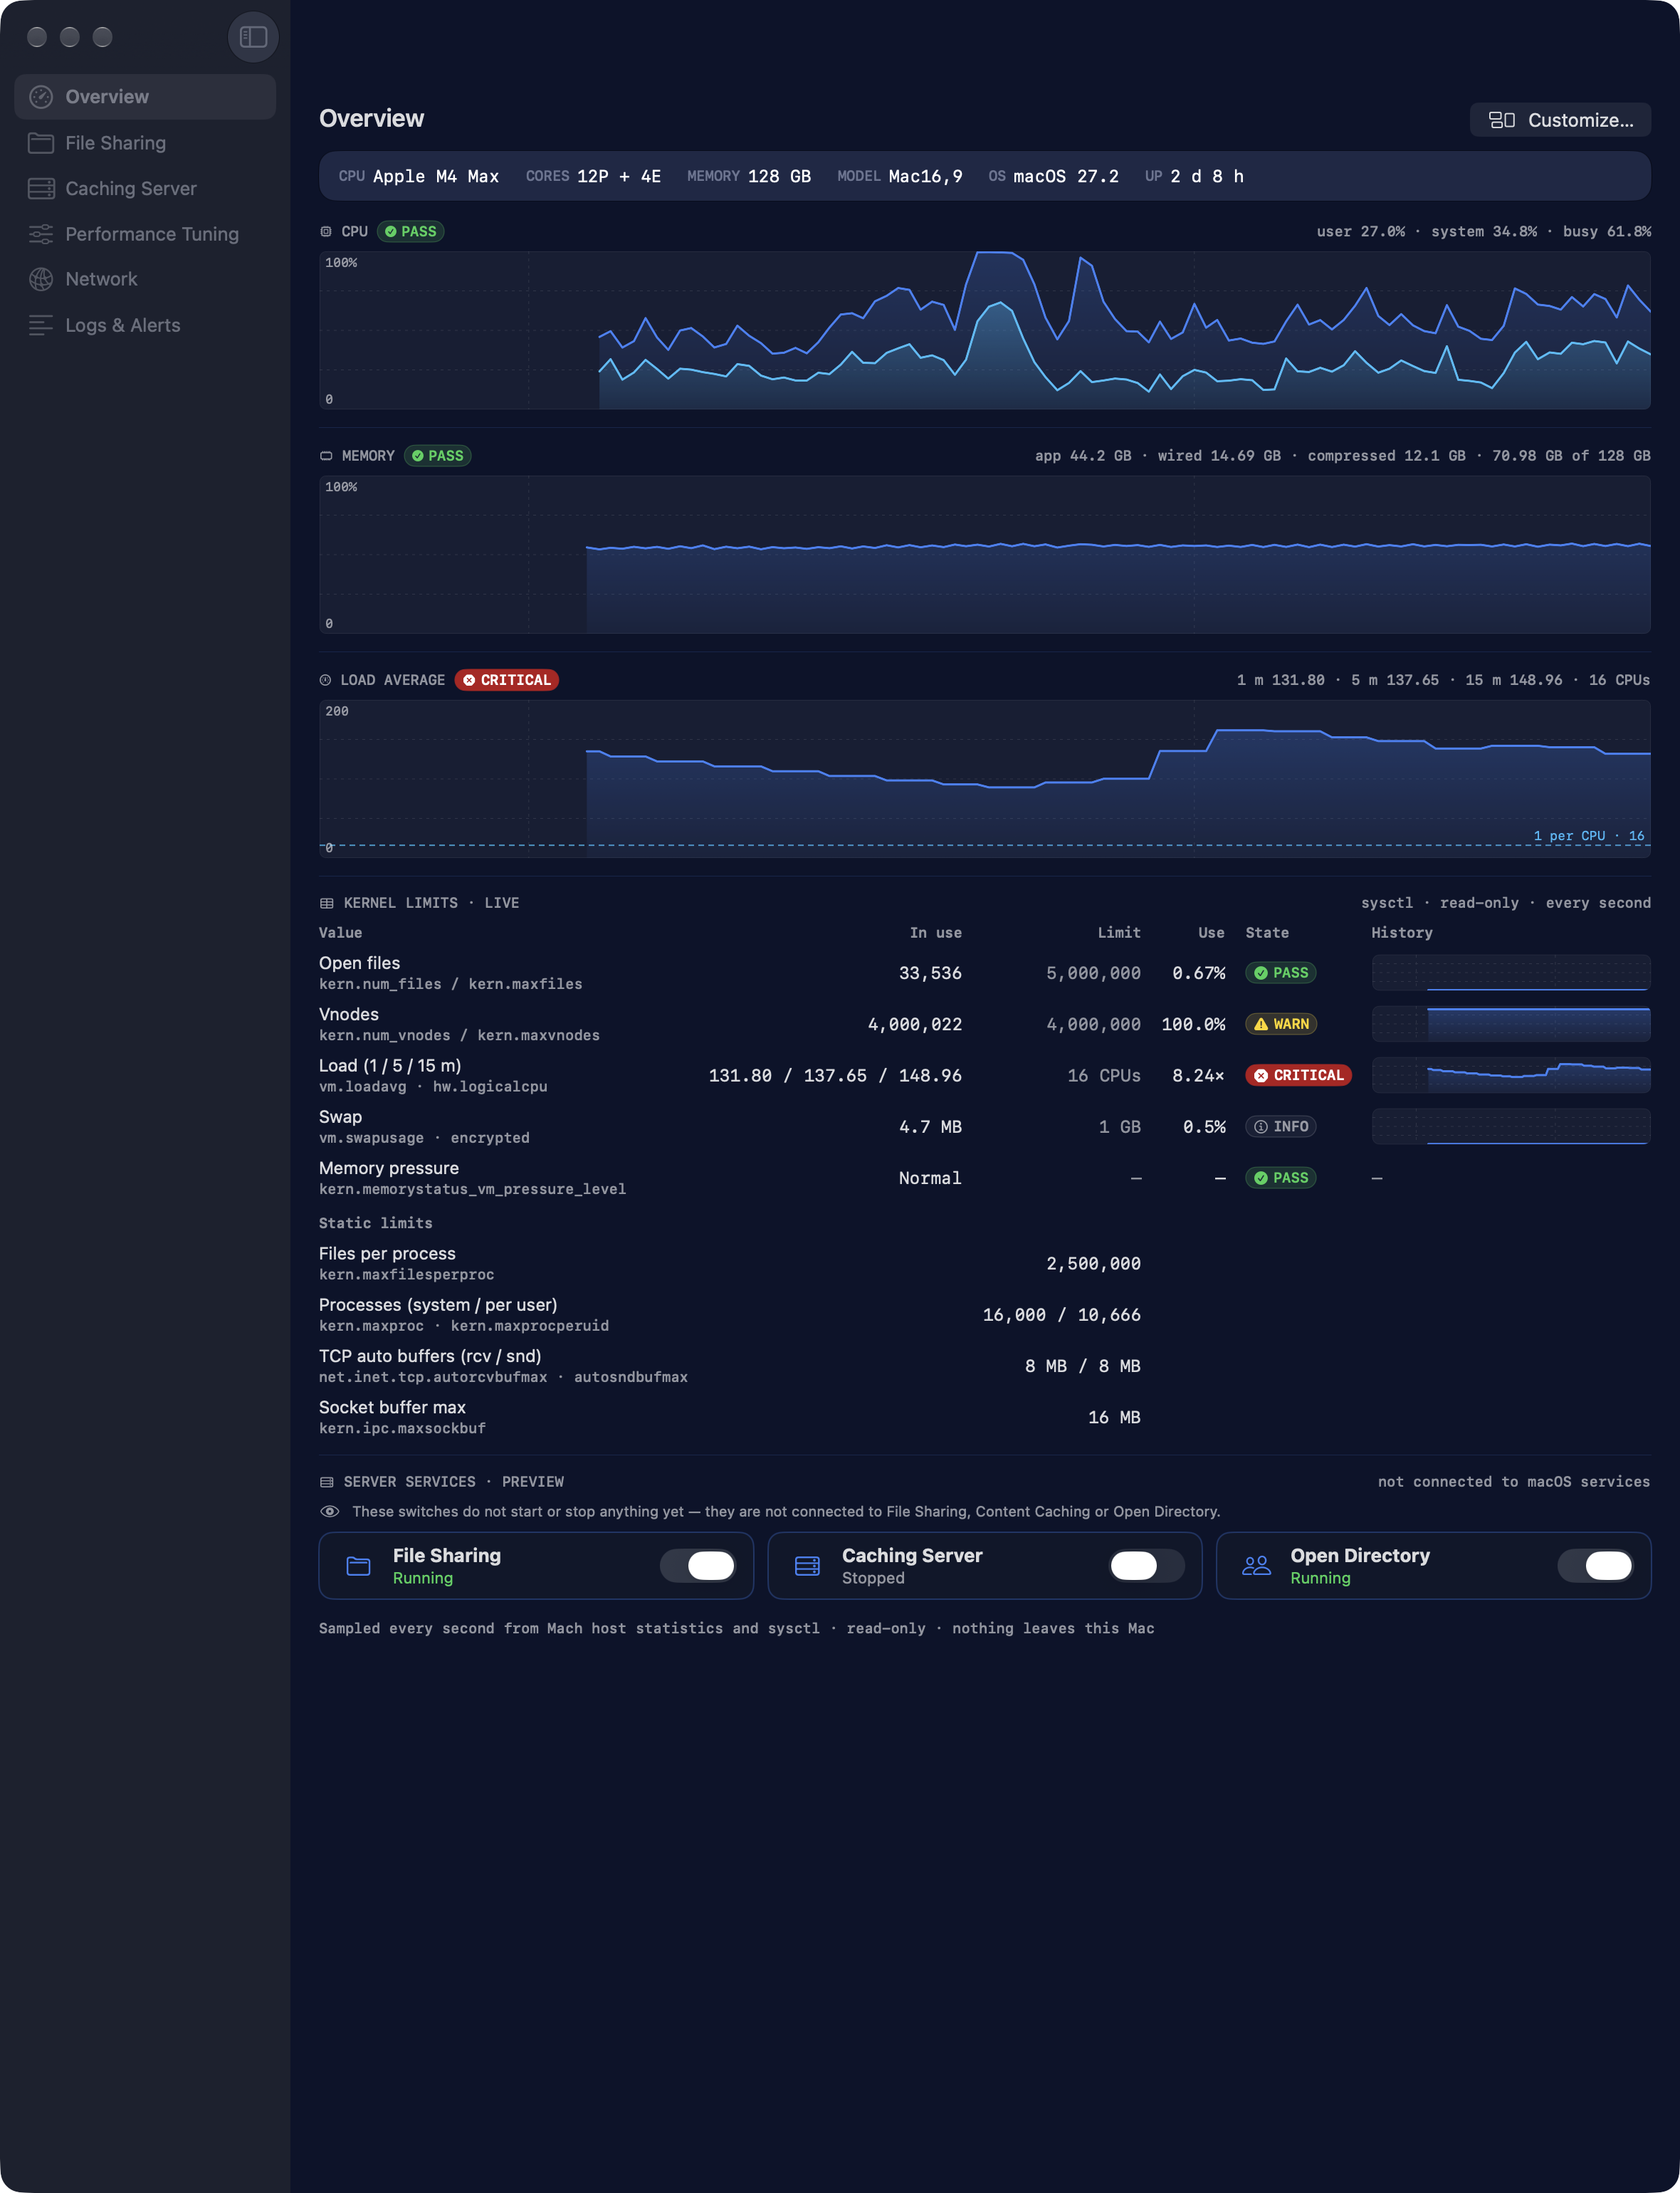
Unified memory and CPU telemetry
Real-time Mach host statistics break down active, wired, compressed and free memory, with per-cluster CPU load.
Kernel limits, live
Open files, vnodes, processes, swap, socket buffers and memory pressure, read with sysctl and graded against their limits.
Workload recommendations
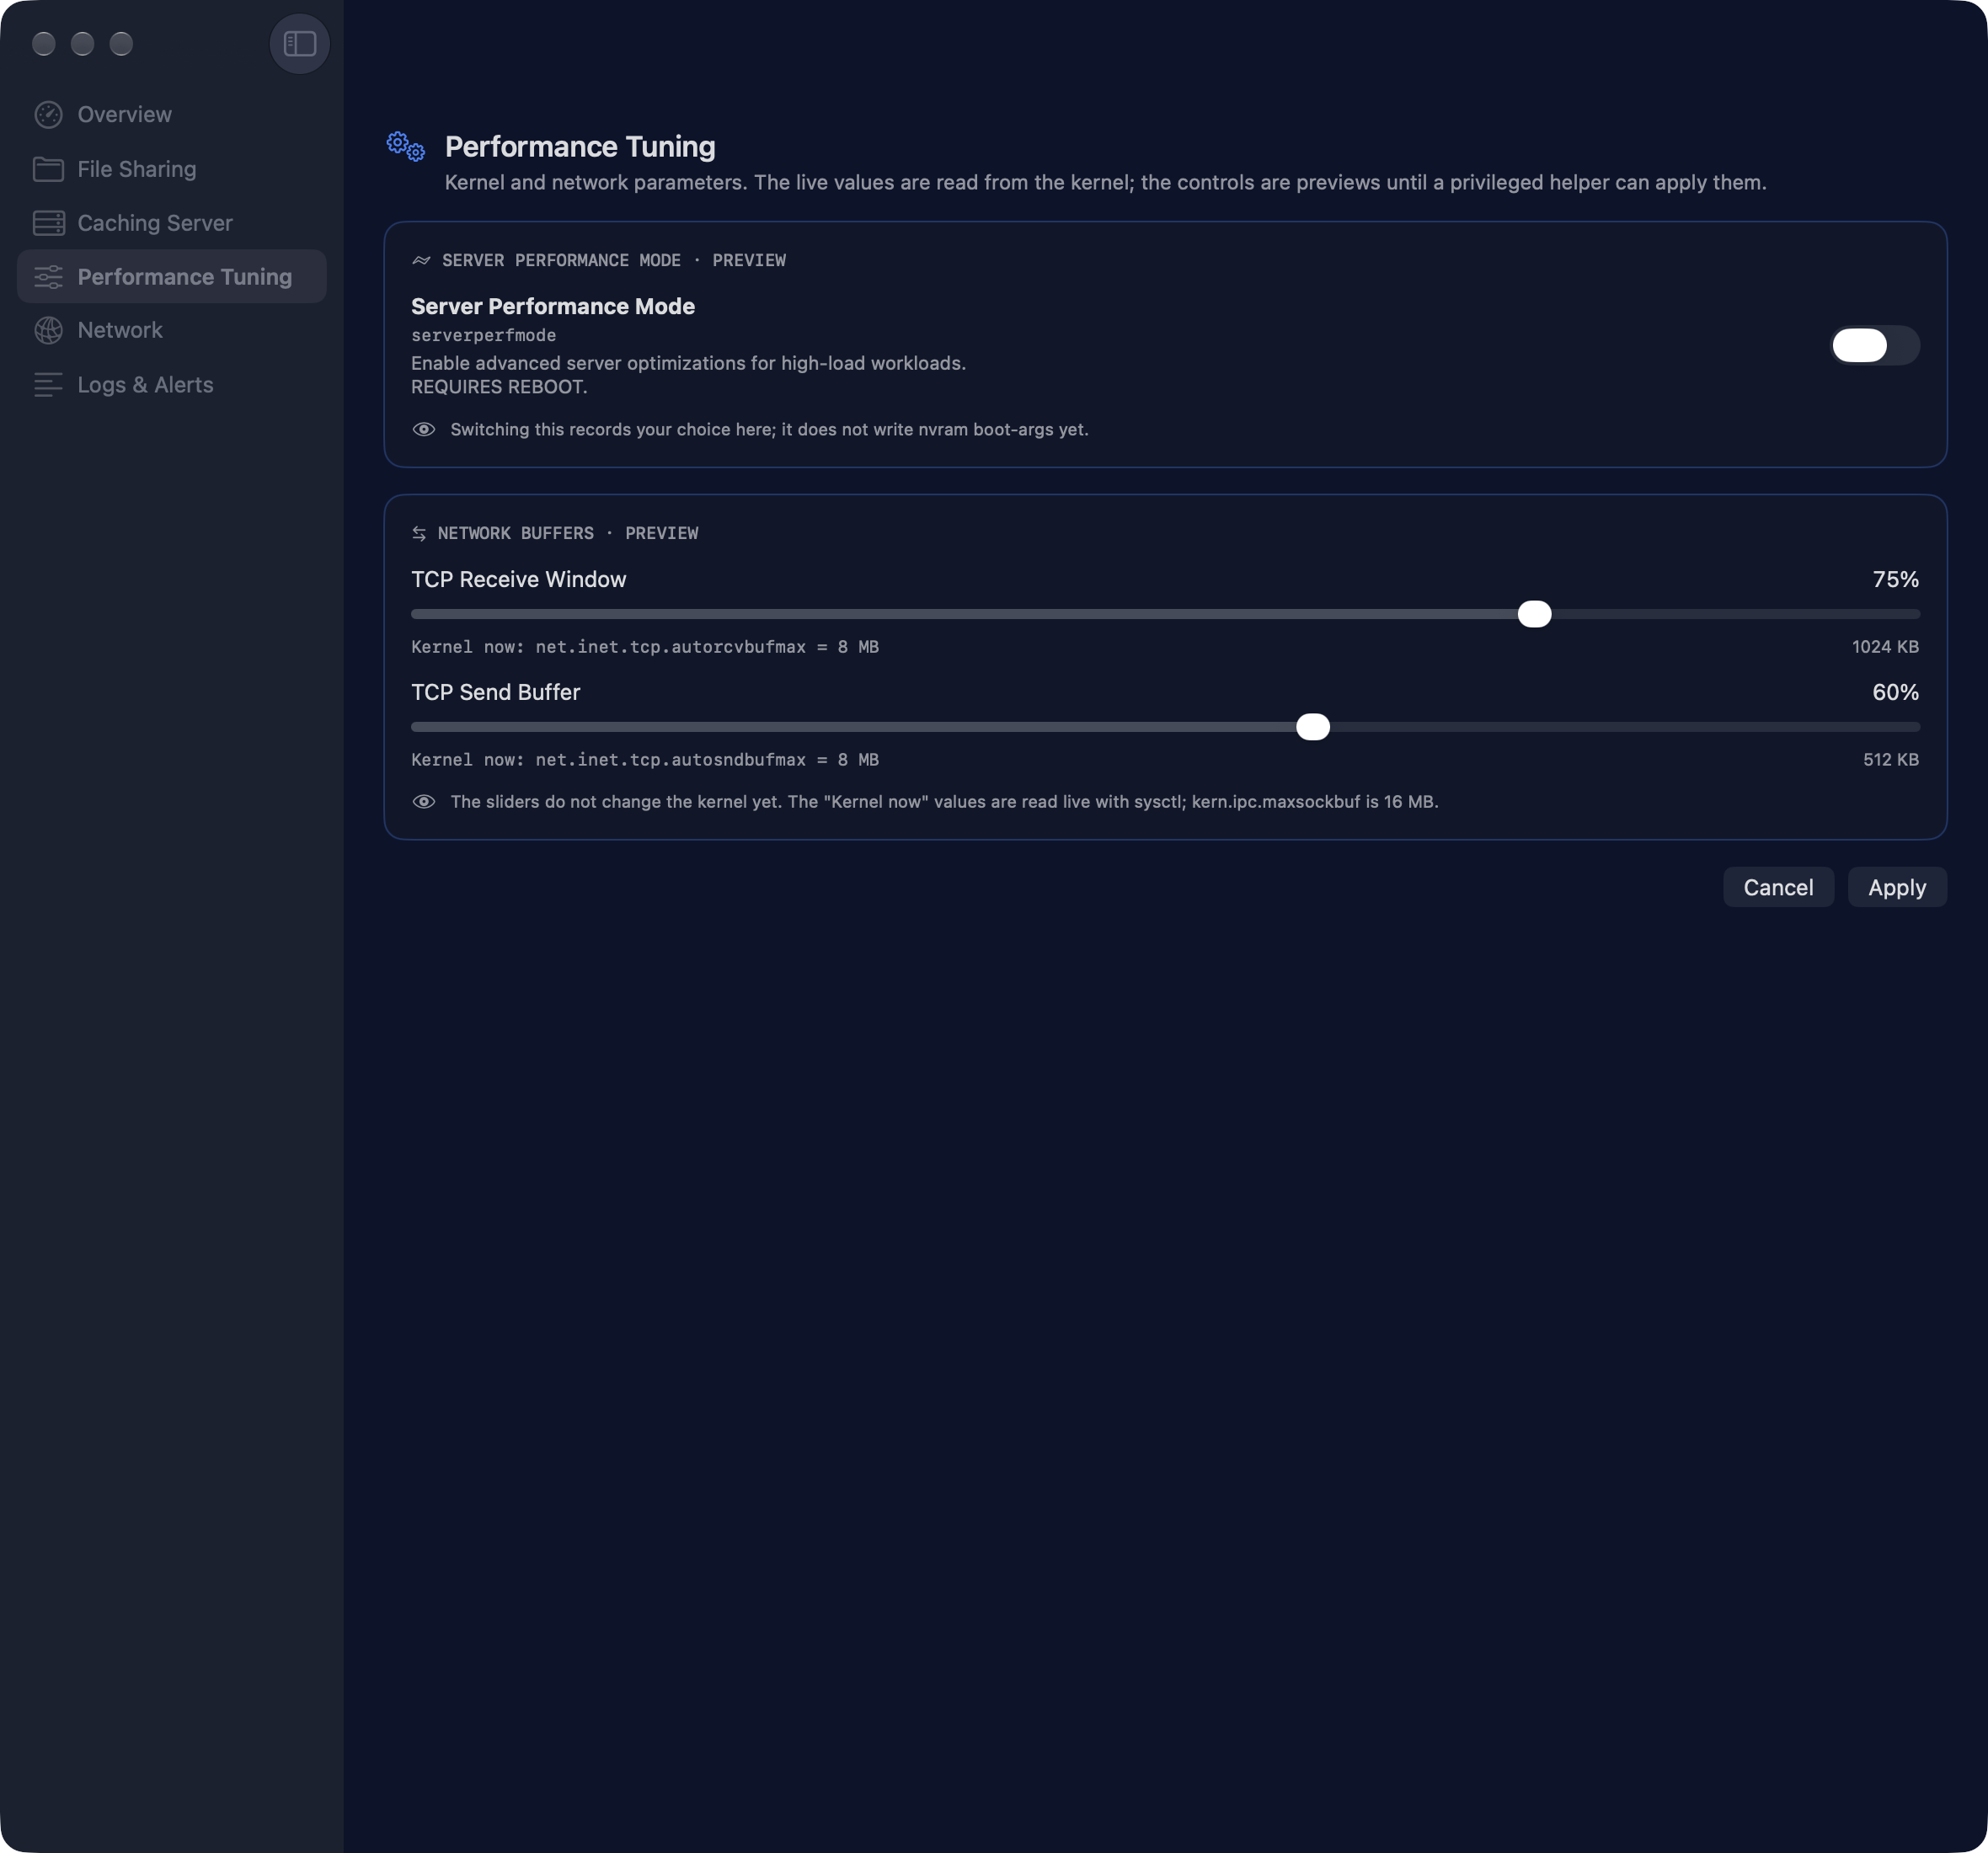
Evaluate tuning recommendations for large memory models, heavy cloud-sync pipelines and high-speed network interfaces.
Hardware profiling
CPU brand, core topology, cache structure and interface throughput at a glance.
Menu bar and full window
Keep vital statistics in a lightweight menu bar panel, or open the full dashboard for in-depth analysis.
Private by design
Runs inside Apple's App Sandbox. No telemetry, no analytics, no remote data transmission: your metrics stay on your Mac.
A closer look
Requirements
- System
- macOS 26 or later.
- Hardware
- Apple silicon (M-series) and Intel Macs.
- Privacy
- No data leaves your Mac. Read the privacy policy.
- Help
- Questions and troubleshooting: HyperTuned support.